
To create this map, I just went to Google Earth and found an elevation on the side of stone mountain. I tracked this elevation and placed a marker every so often. This allowed me to to find the elevation around the mountain.
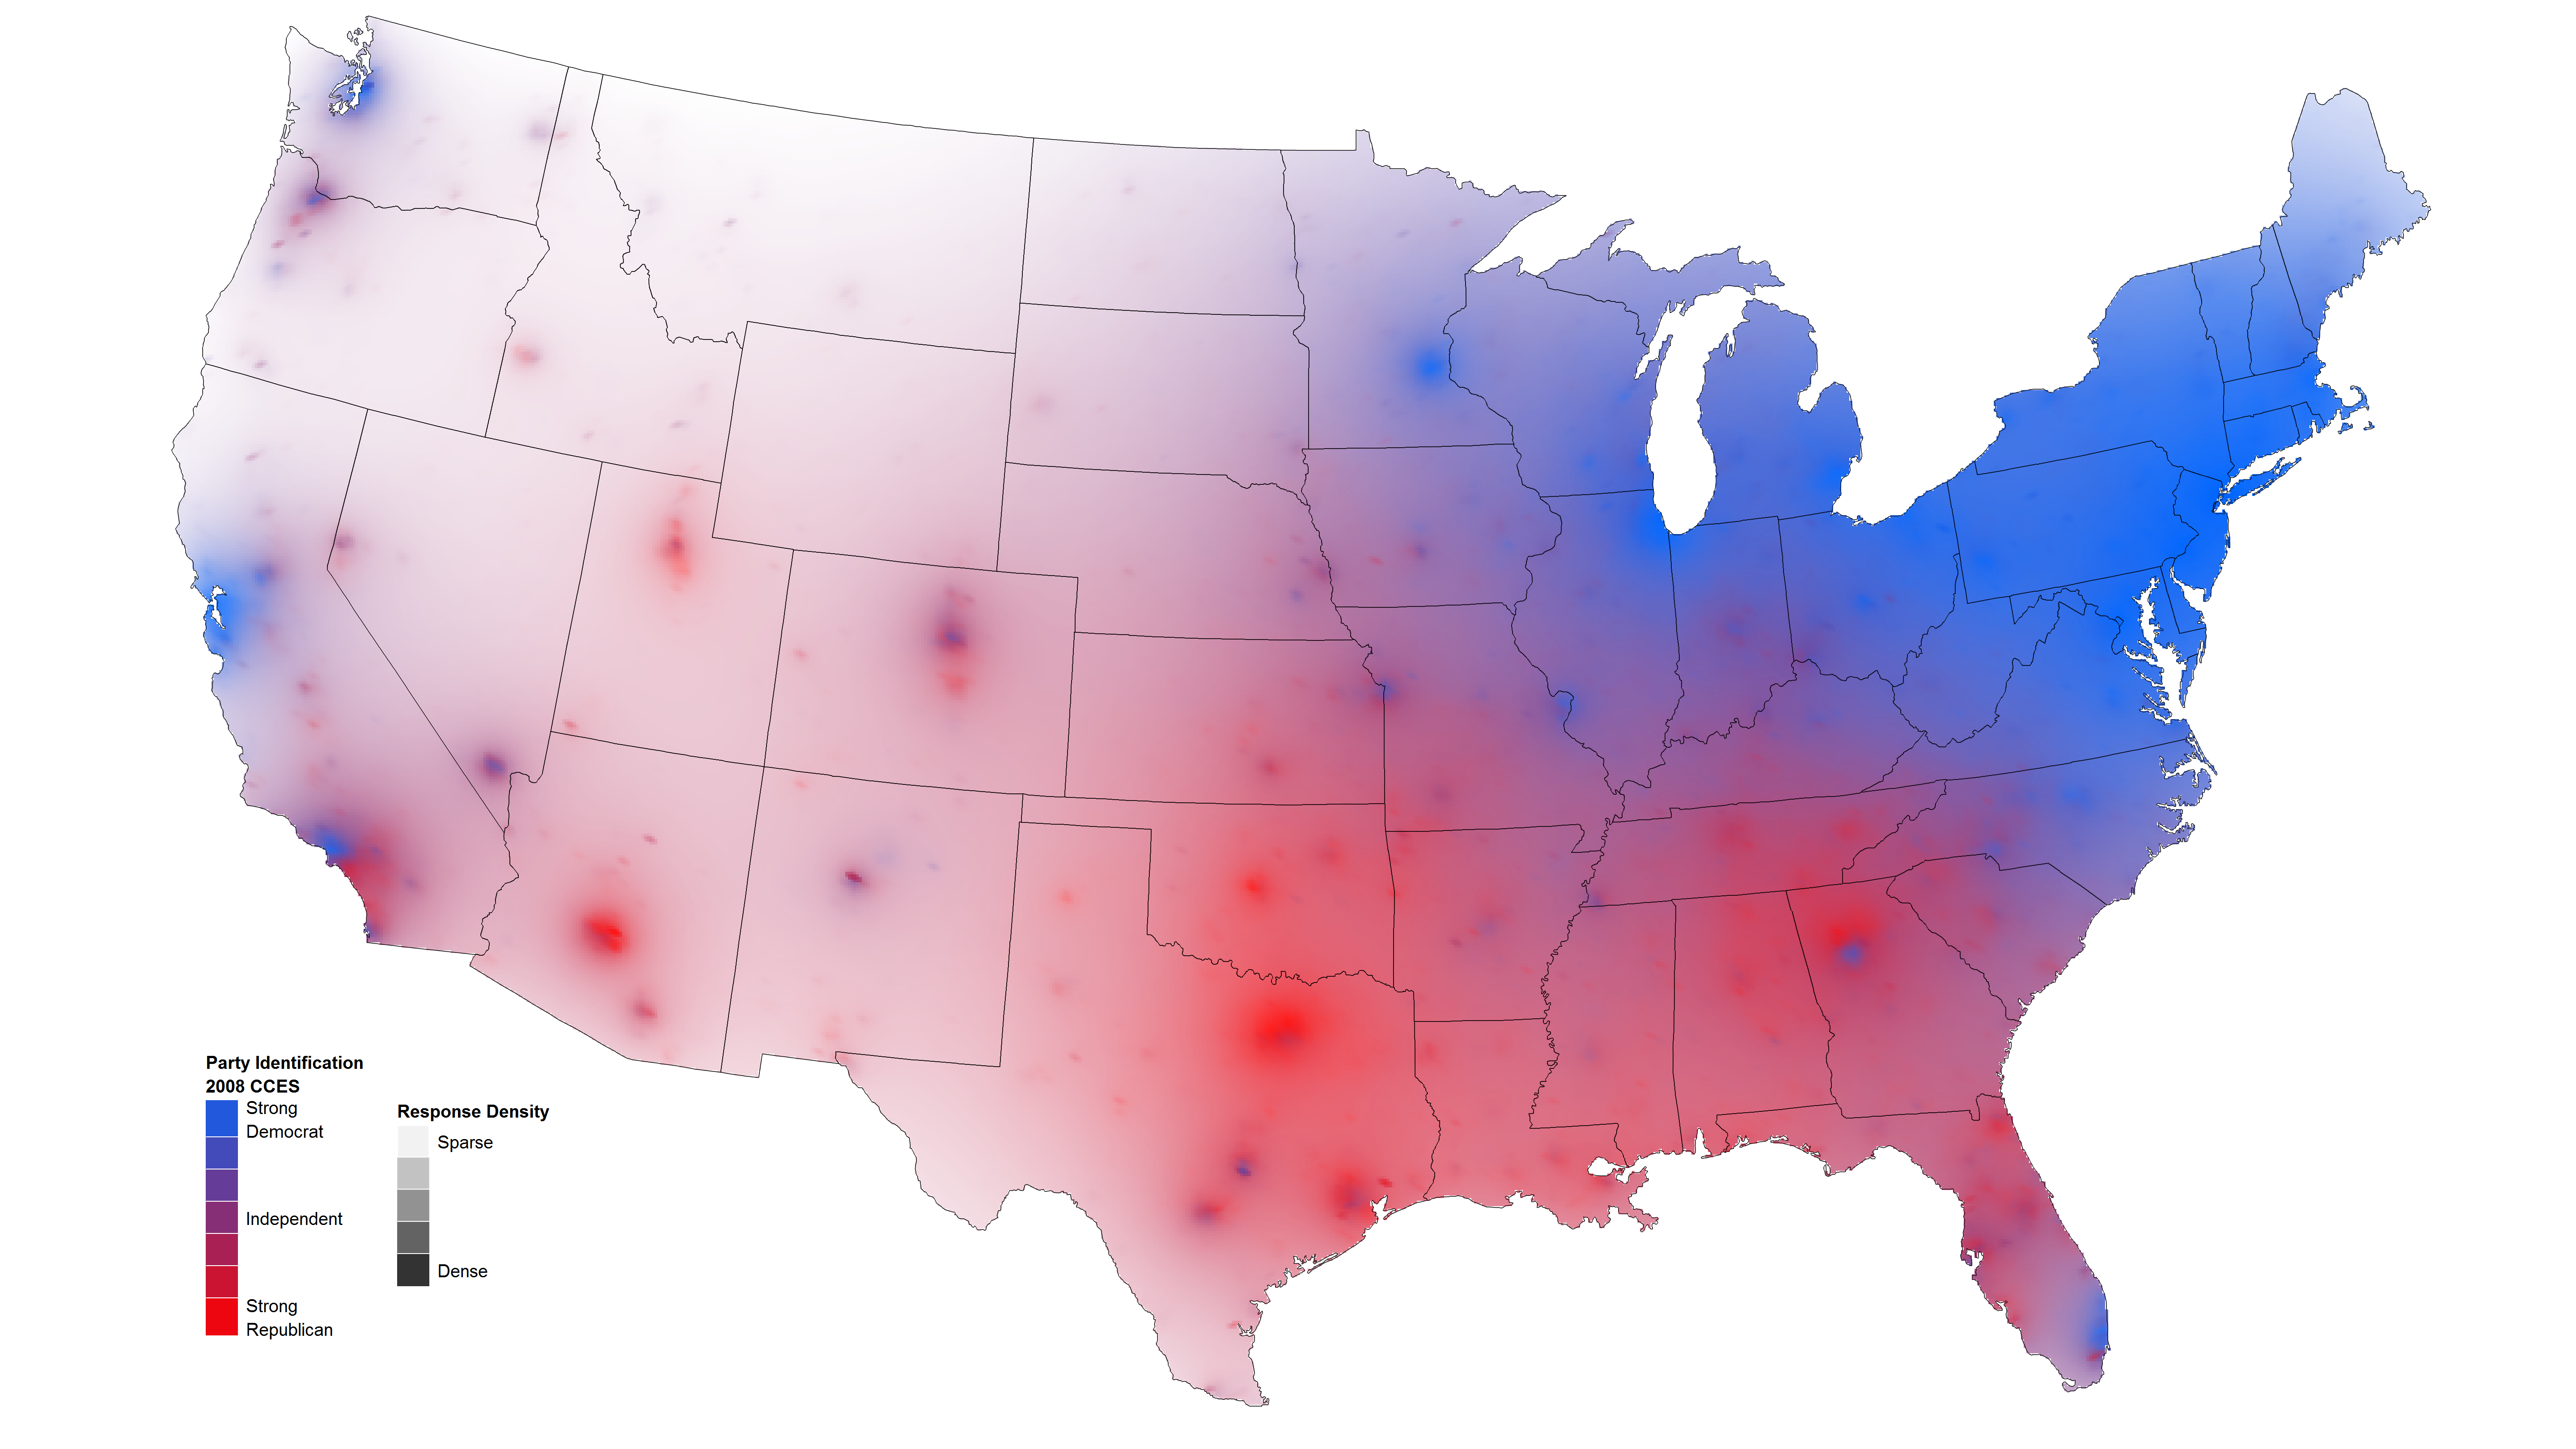 |
| Isorythmic Map |
 |
| Choropleth Map |
 |
| Dot Density |
 |
| Proportional Symbol |
 We conducted this lab to examine the nature of high and low pressure systems. By creating the device, and examining the readings, we were able to understand how, and in what ways, weather pressure systems work. We constructed the device by sealing a rubber balloon to the top of a bowl and taping a straw to the top of the latex surface.

 |
| Obsidian |
 |
| Marble |
 |
| Sandstoen |
 |
| Day 7 |
 |
| Day 10 |
 |
| Day 13 |
| Day 54 |

 The sun lab required setting up a table. To set up this table, I had to go outside and take measurements with a pole of a known length. Then, I took the measurements of the shadow and used a compass to find the direction of the sun. After calculating the Tangent of the measurements, I had the numbers necessary to fill out the radial chart. Included in this post are my supporting documents.
 (Information gathered for February 5th)
 |
| from suncalc.com for Feb 5. |


